Extreme weather events such as droughts and heavy rainfall are increasingly damaging agricultural ecosystems. In order to better prevent the damage caused by climate change, we need to better understand the movement of water through the soil, plants and air. Therefore, it is important to study both individual plants and entire landscapes.
Our “IsoFlux” project focuses on water fluxes in the agroecosystem. We use the new and fully automated measuring system FluxCrane to carry out concentration measurements of water as well as measurements of the water stable isotopes, 18O and 2H (deuterium). The isotopic signature of the water changes (fractionates) in the system, making it an ideal tracer for investigating water fluxes (Fig. 1). These are measured using a cavity ring down spectrometer (Picarro, USA), which is used both for direct measurement in the FluxCrane and for subsequent analysis of water samples in the laboratory. With these measurements we can show the water that enters the atmosphere through soil evaporation and plant evaporation (transpiration) - together called evapotranspiration. In addition, we take different samples to determine the isotopic signature and the amount of 1) precipitation water entering the system, 2) soil water at different depths, and 3) plant water to determine root water uptake.
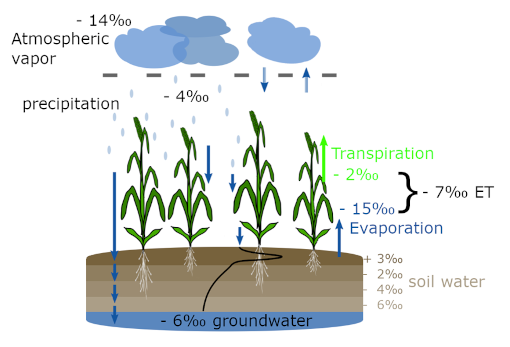
Figure 1: Schematic representation of changes in water stable isotopes in agricultural ecosystems. © Mathias Hoffmann.
The automated system generates evapotranspiration data with high temporal and spatial resolution, resulting in a new class of data. We use machine learning and data-driven modeling approaches to achieve better prediction results with this high-resolution data as well as campaign-based measurements. For the modeling itself, we test different combinations of general environmental parameters and plant-specific parameters. The focus is on the improvement and simplification of the evapotranspiration prediction (Fig. 2) and the division into evaporation and transpiration.

Figure 2: Example of daily evapotranspiration (left y-axis with light blue line) and cumulative evapotranspiration over 3 years. The zero line provides information on the period with cultivated crops (green) and fallow land (brown). © Mathias Hoffmann.
We combine this data with other methods from plant and water research to better understand the water cycle and thus be better prepared for future climate conditions. We also link our findings to the carbon cycle (link FluxCrane/FluxWeb?) to gain a holistic understanding.